Cobra Effect · Statistics and probability
Mean and median
Why the average can describe nobody at all.
6 cards, read aloud in 2:21, with a test and sources.
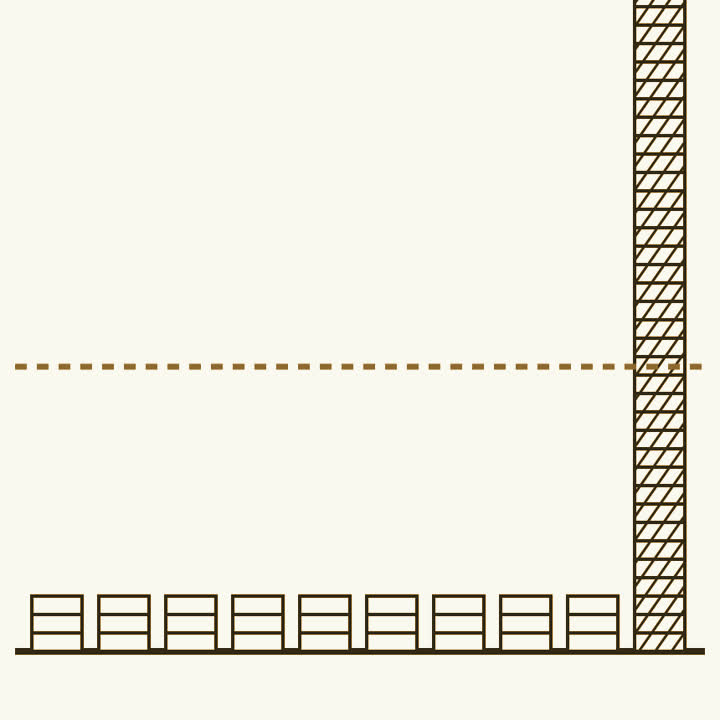
Bill Gates walks into a bar.
Before he arrives, the nine people drinking there are each worth a modest sum. When he sits down, the average wealth in the bar jumps into the billions. Nobody in the room got richer. The average did.
That is the mean. It adds everyone up and divides.
One big number drags it anywhere. The median is the person in the middle when you line everyone up in order. Add Bill Gates and the middle person barely moves. Two averages. One room. Answers a billion apart.
Each one lies in its own way.
The mean lies whenever a few values are huge. Incomes, house prices, the time a page takes to load. The median lies whenever the total is what matters. A hospital planning beds needs the mean stay, because beds are filled by the sum of all stays. Ask what you will do with the number, then pick.
1982. A palaeontologist reads that his median survival is eight months.
Stephen Jay Gould had a rare abdominal cancer. Half of patients died within eight months. But the other half stretched out in a long tail, some for years, and Gould was young, well treated and diagnosed early. He lived another twenty years, and wrote an essay called The Median Isn’t the Message.
The average is a summary. The shape is the story.
In Britain in 1800, life expectancy at birth was around 40. Adults were not dropping dead at 40. Children died in vast numbers and pulled the mean down. A person who reached 20 could expect to live into their sixties. One number hid two very different lives.
Three questions before you trust an average.
Mean or median? If they didn’t say, assume it is whichever flatters the point. How far apart are the two? A big gap means a long tail, and the tail is where the story lives. And who is Bill Gates in this room?
Sources
- The Median Isn’t the Message, Stephen Jay Gould, 1985. The essay, first published in Discover magazine. Search the title. A statistics lesson written by a man reading his own survival curve.
- How to Lie with Statistics, Darrell Huff, 1954. The chapter on the well chosen average is the classic on mean, median and mode, and the whole book is a short course in reading numbers.
- Median, Wikipedia. What the median is, why it shrugs off extreme values, and where it fails you. The section on skewed distributions is the useful one.
Nearby ideas
- The law of small numbers. Small samples swing wildly, and the swings look like signals.
- Simpson’s paradox. A trend in every group can reverse when the groups are combined.
- Survivorship bias. The failures you never see can reverse the lesson you draw.
- The Literary Digest poll. A small sample chosen well beats a huge one of the wrong people.
- The garden of forking paths. Choosing the analysis after seeing the data makes flukes look real.
- Regression to the mean. Extreme results drift back towards normal, whatever you do.
- The Monty Hall problem. Why switching doors wins twice as often as staying put.
- The birthday problem. Coincidences are far more likely than they feel.